Realtime dashboard for Oban
Oban Web brings every job, queue, schedule, and workflow from your Elixir and Python nodes into a single realtime dashboard. Zero infrastructure required.
Jobs
See every job across every node, drill into args, meta, and errors, and cancel, retry, or delete with a click. Filter by state, queue, or worker; the list updates live as the cluster works.
Live cluster updates
Every node, in one view, no refresh.
Search and filter
Filter by state, queue, worker, or args.
Bulk actions
Cancel, retry, or delete in batches.
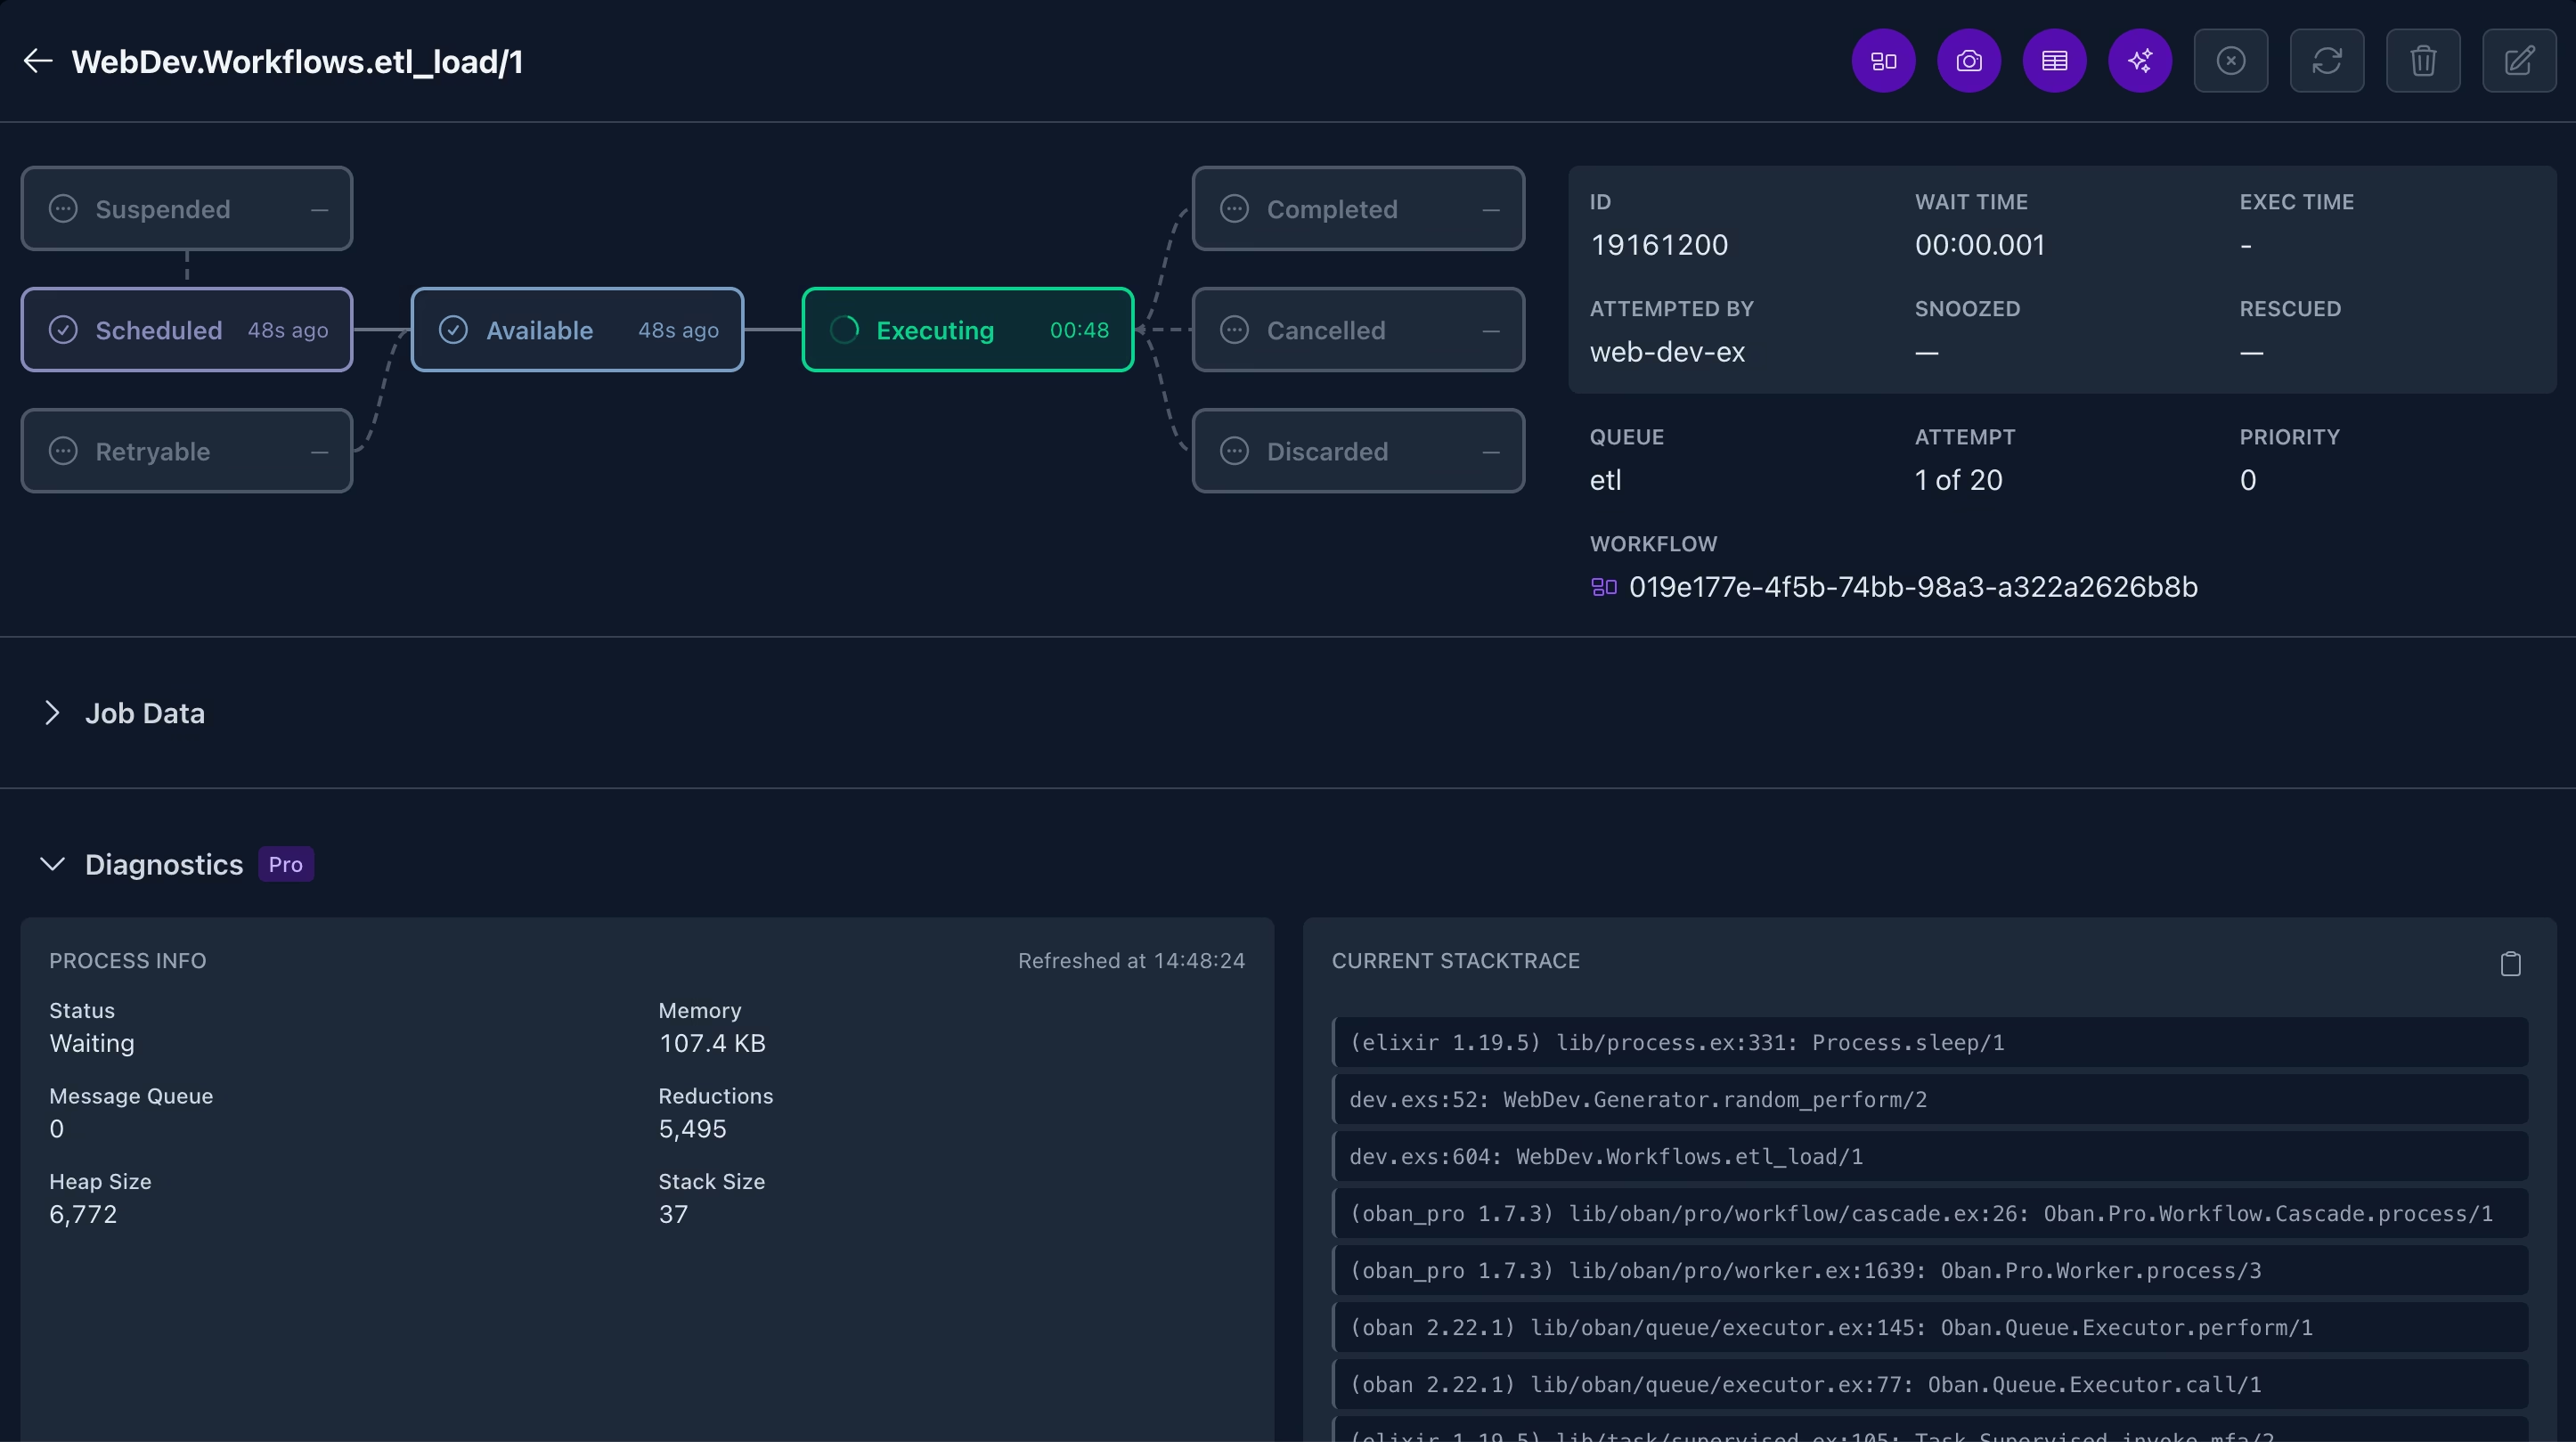
Live diagnostics Pro
Inspect what a running job is doing right now.
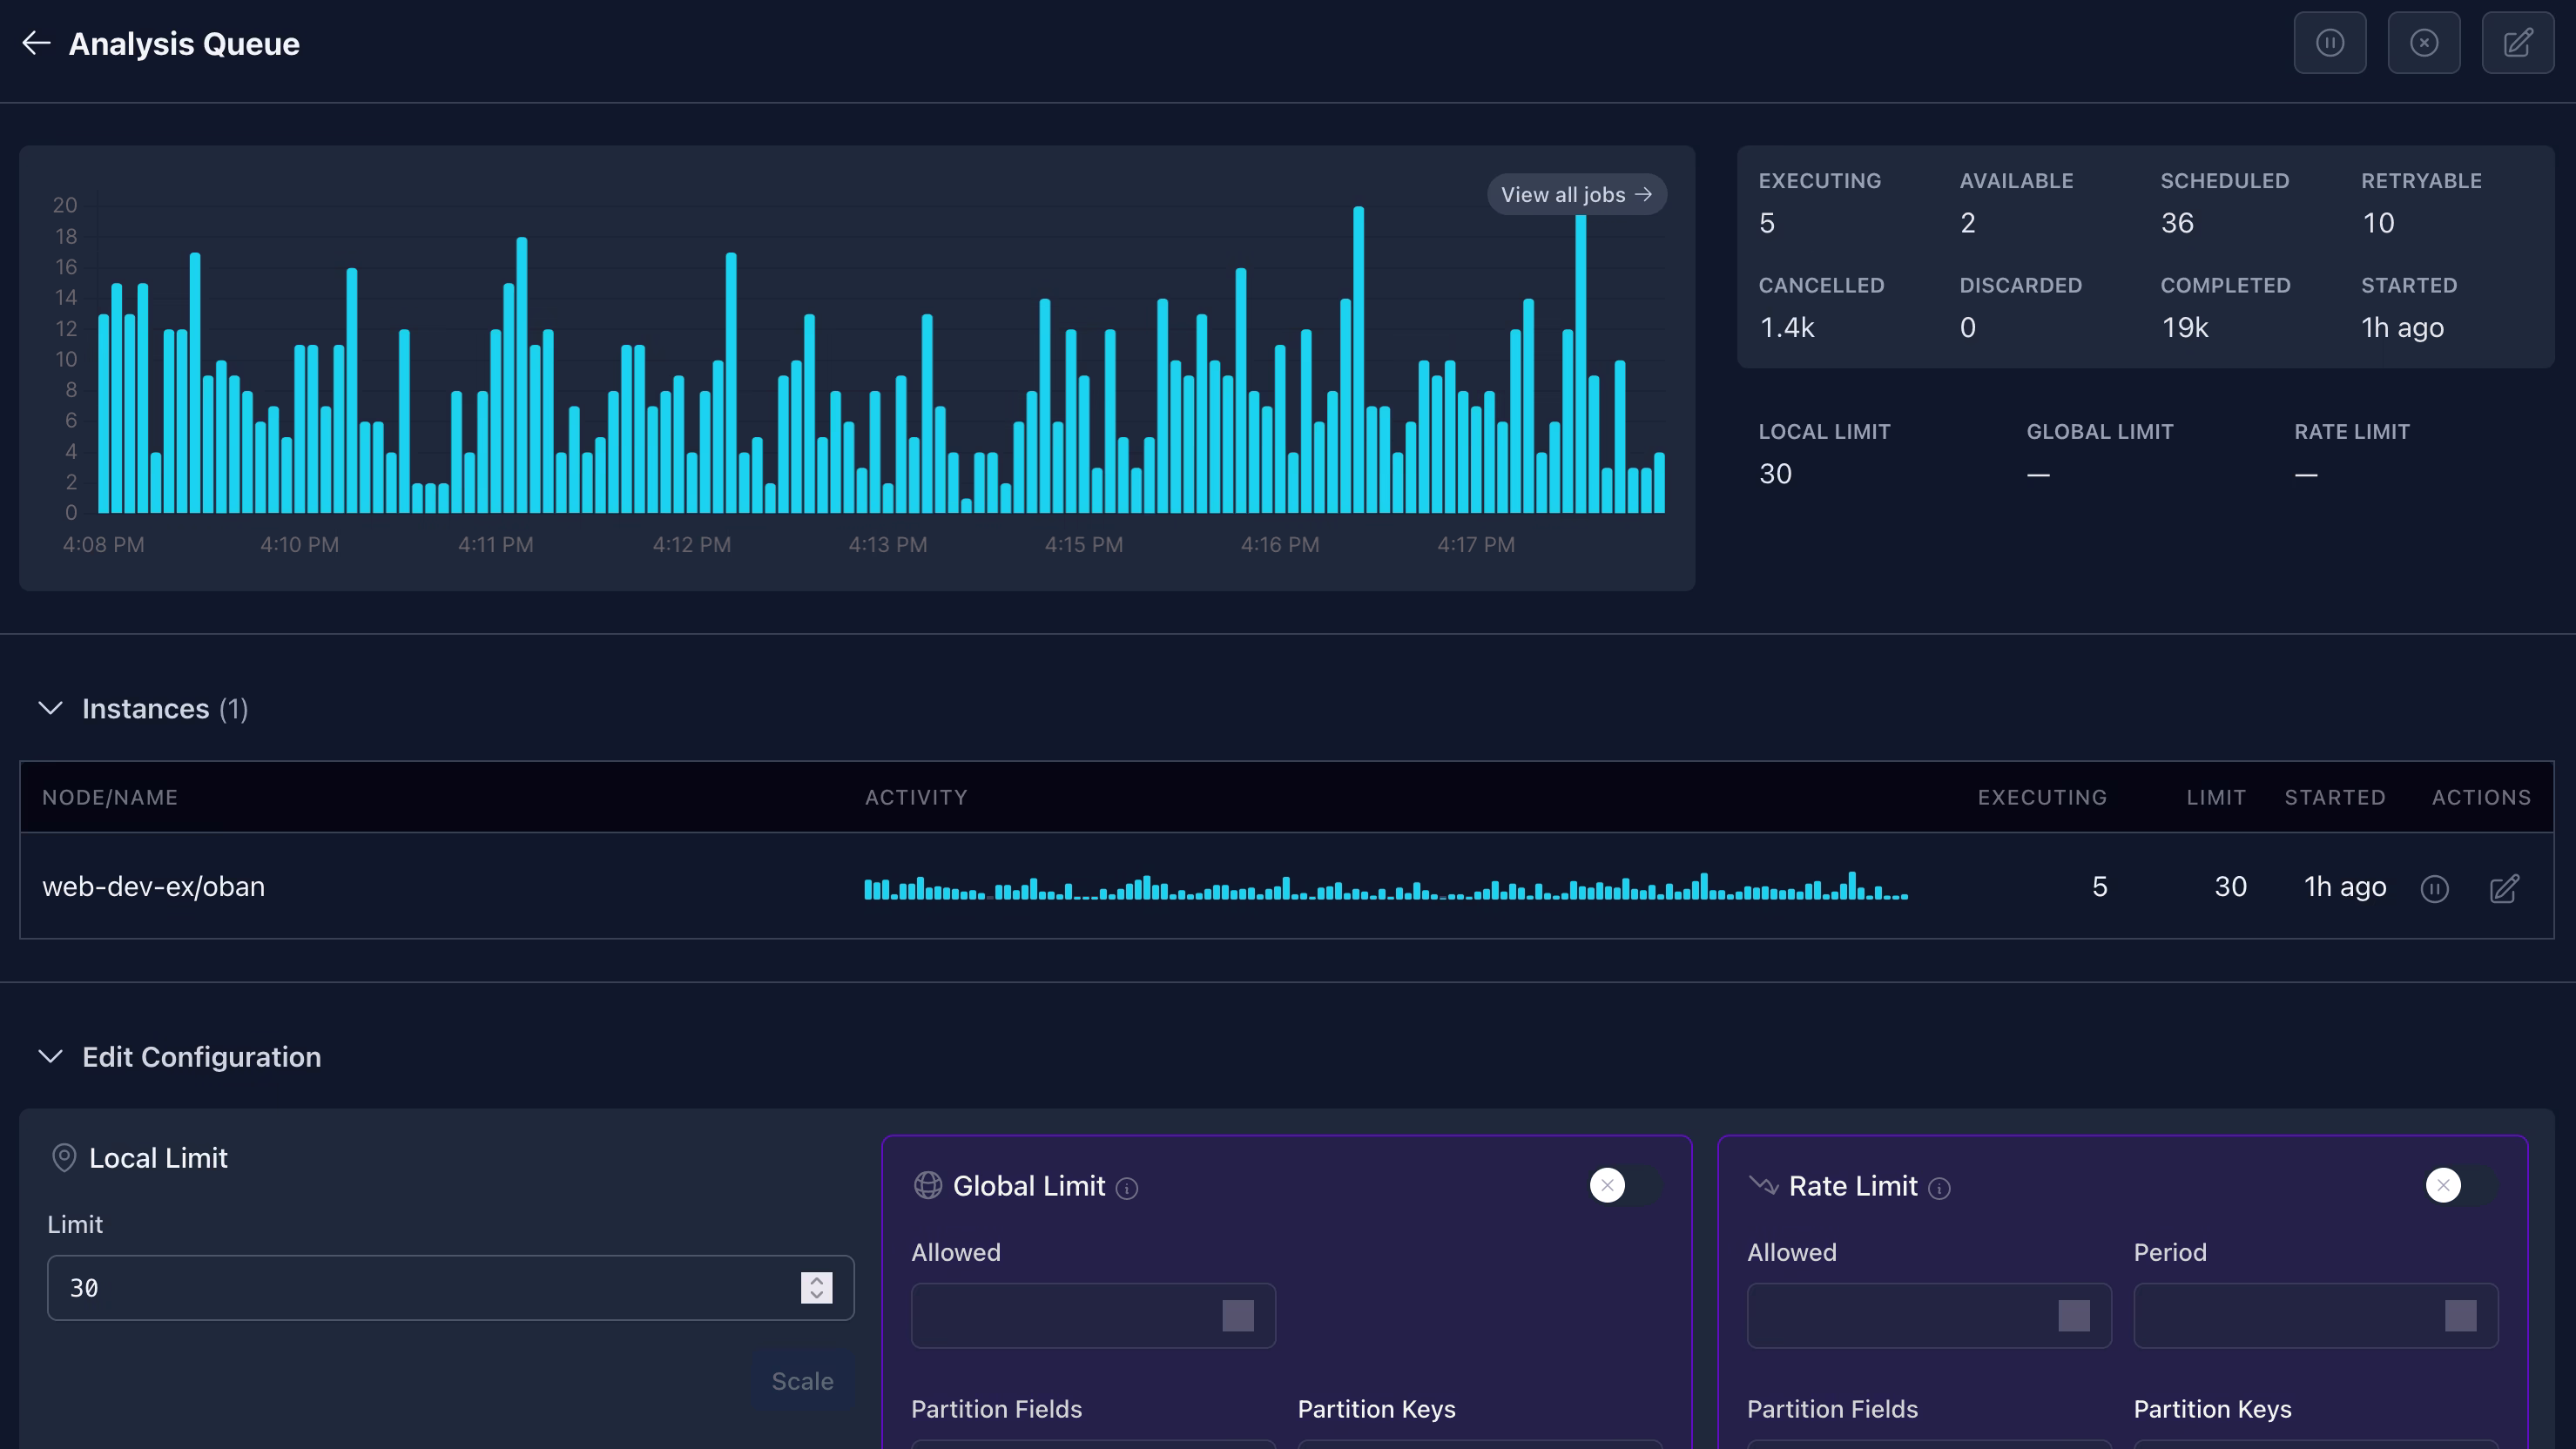
Queues
See throughput at a glance, drill into per-node stats, and tune limits without a deploy. Pause, resume, and scale concurrency across the entire cluster.
Pause and resume
Stop and start queues, no deploy needed.
Adjust concurrency
Tune limits on the fly, no restart.
Per-node visibility
See which jobs each node is running.
Global limiters Pro
Cluster-wide caps and rate limit visibility.
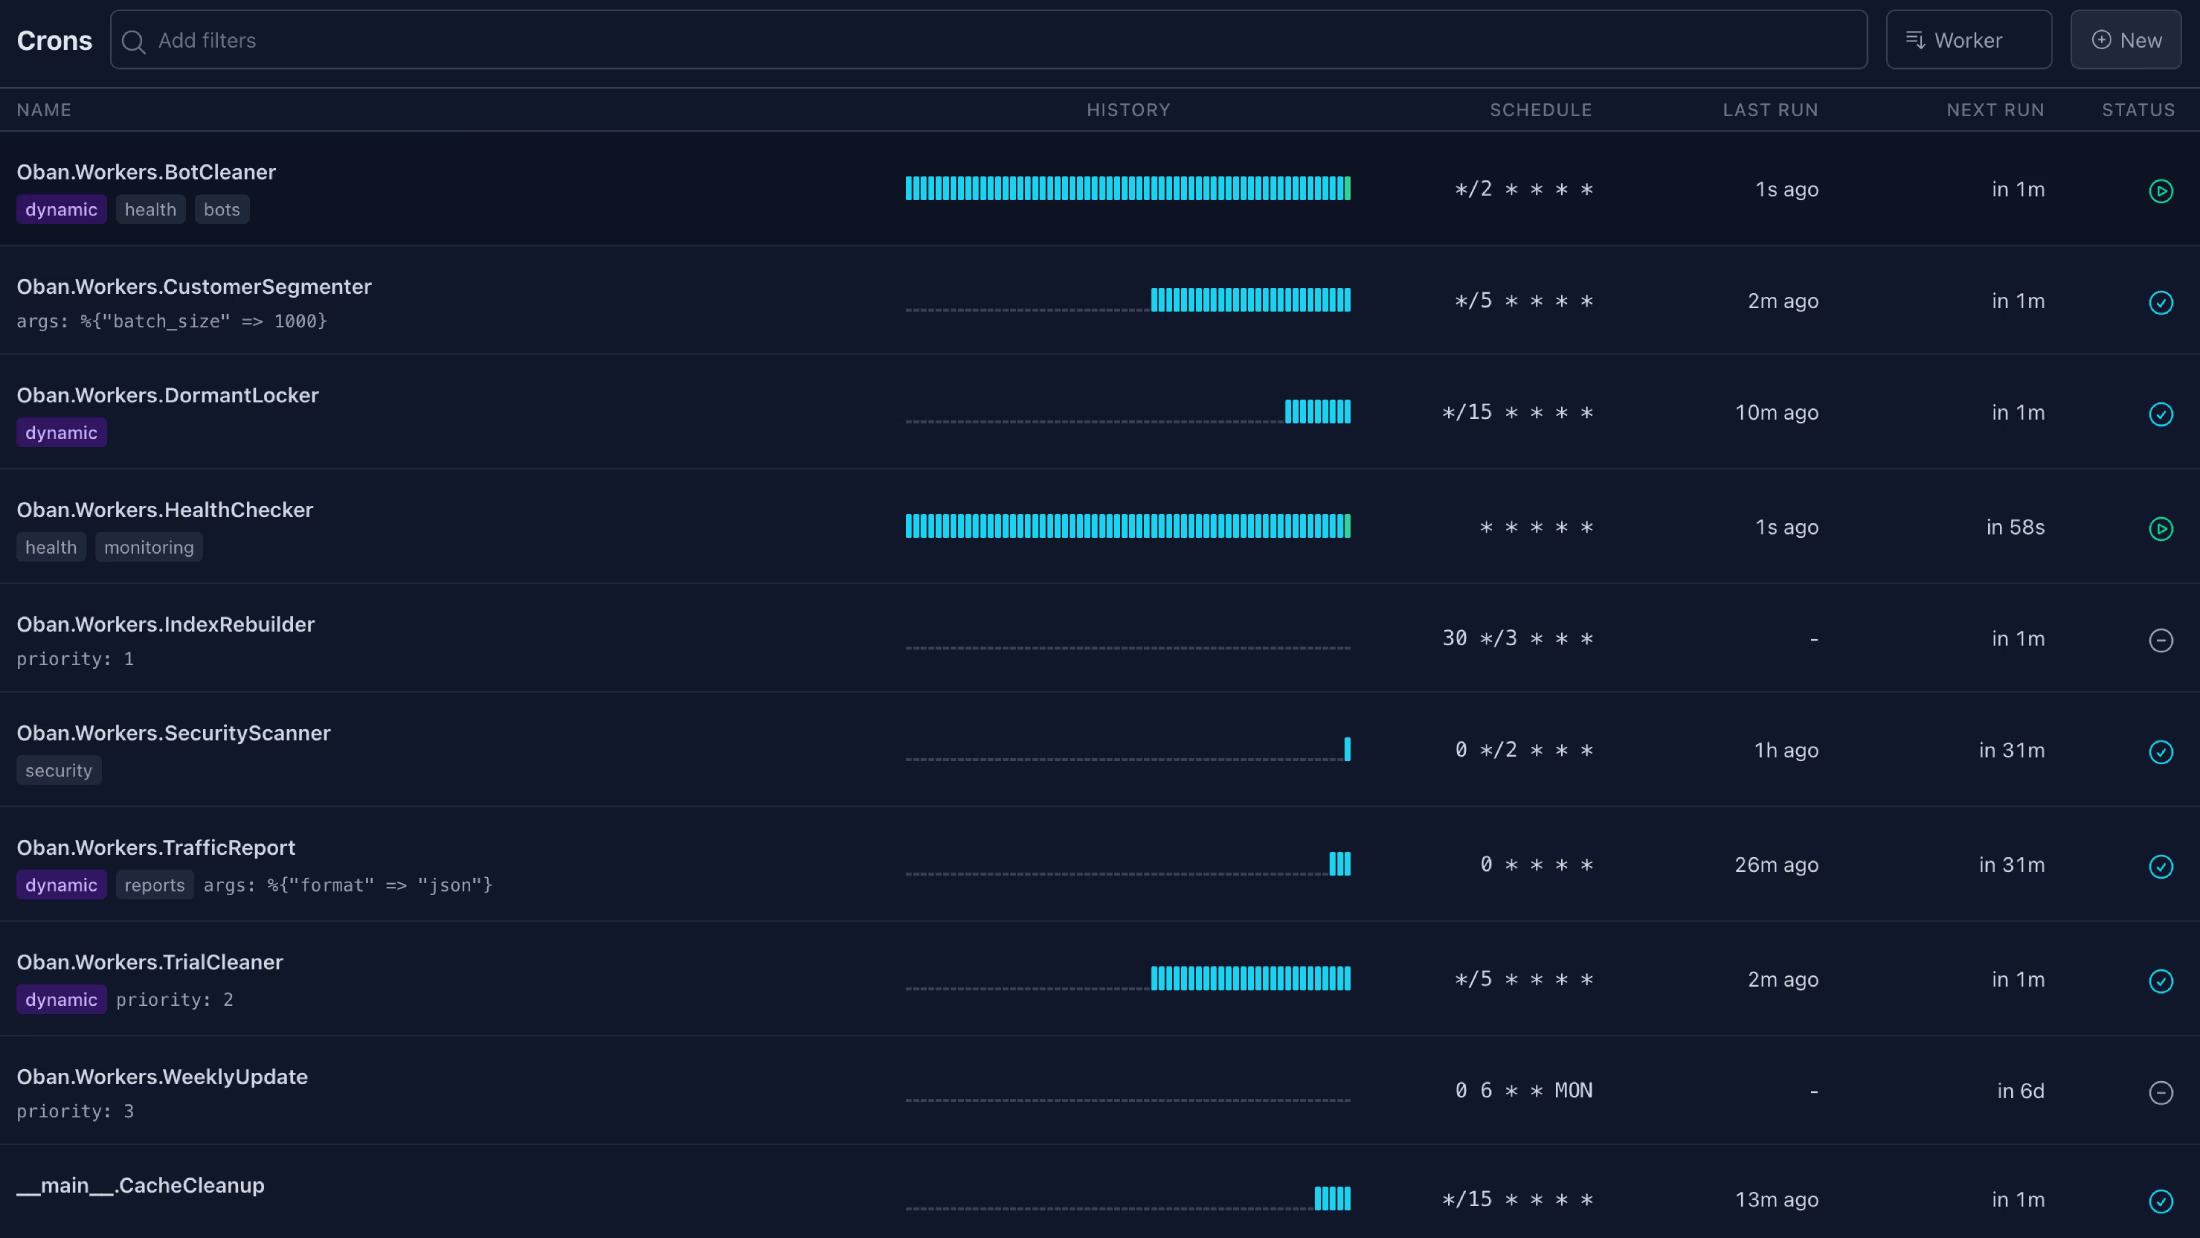
Crons
Every scheduled job in one place. See the next run, recent history, and trigger a schedule manually when you need to verify a fix or backfill data.
Schedule overview
See every cron and its next run.
Run history
Browse recent runs and see what failed.
Manual triggers
Trigger a schedule on demand.
Runtime editing Pro
Add and tweak schedules without a deploy.
Workflows Pro
Visualize workflows as jobs progress through their dependencies in real time, and pinpoint failures in fan-out and fan-in patterns at a glance.
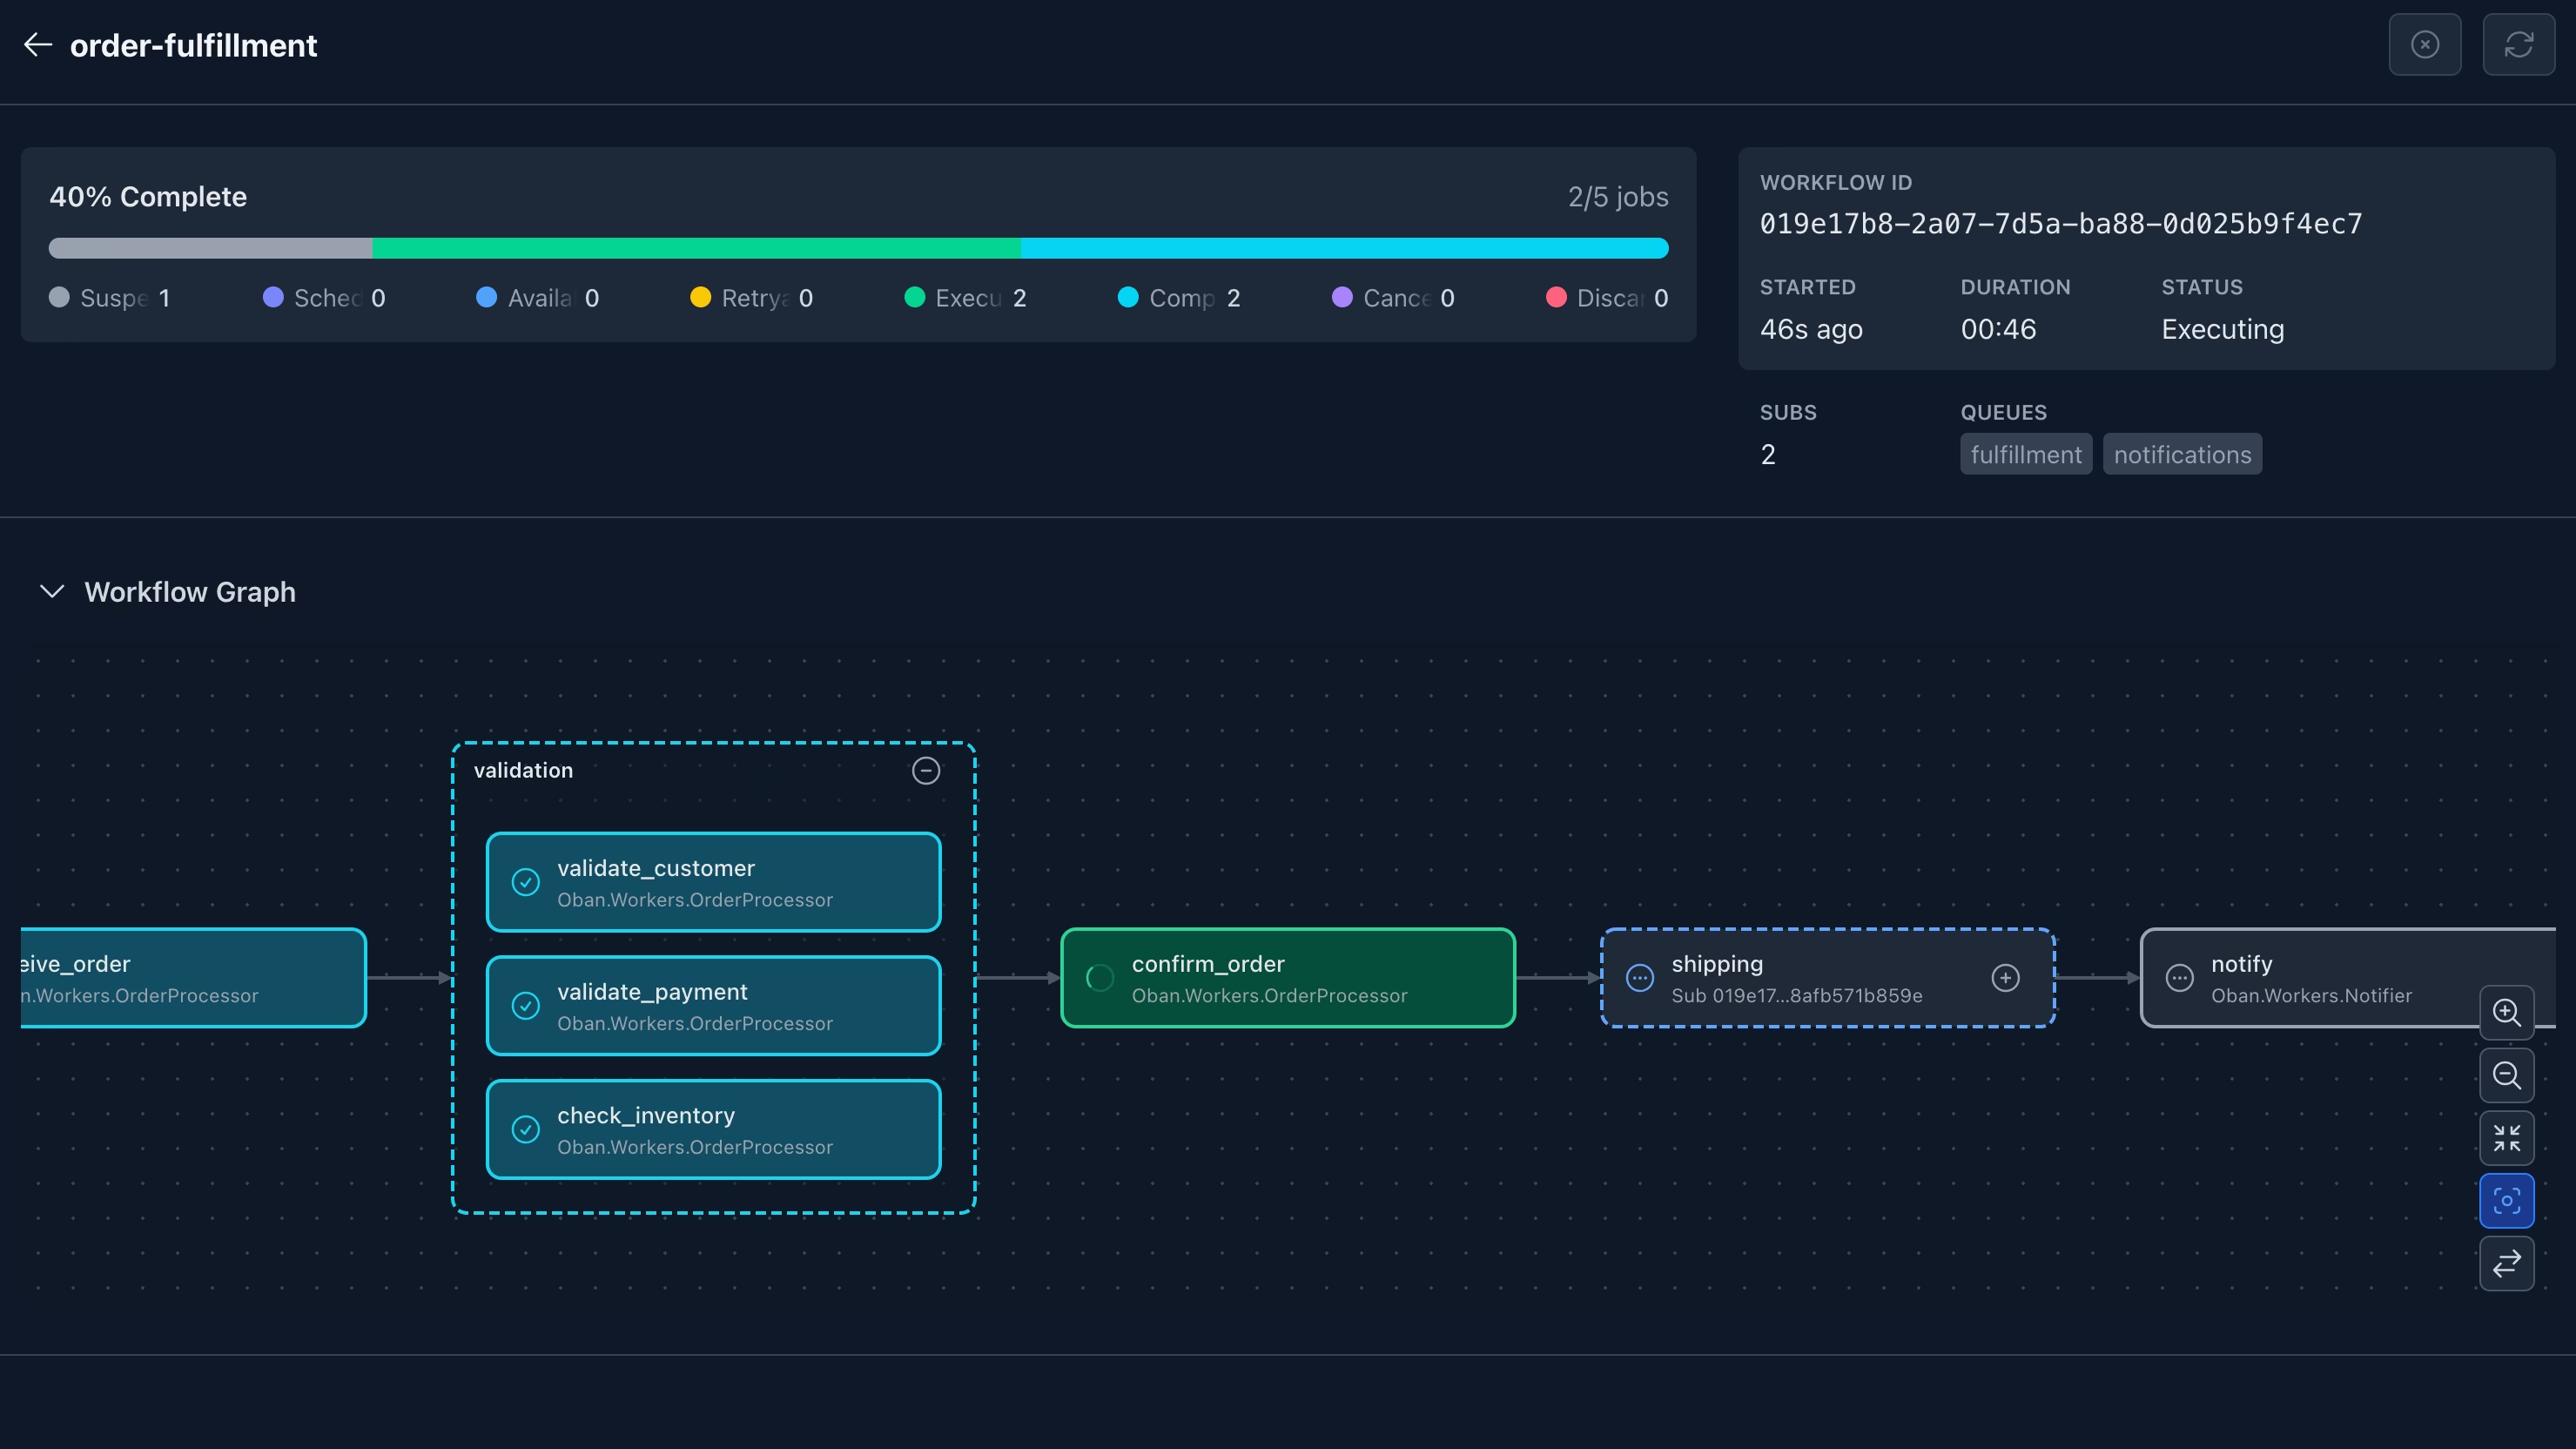
DAG visualization
Dependencies as an explorable graph.
Live progress
Watch jobs and sub-workflows execute live.
Retry workflows
Re-run from the broken step forward.
Sub-workflows
Drill into nested workflows inline.
Live Metrics, No Infrastructure
Throughput, queue depth, and execution time, aggregated on every node and relayed straight to the dashboard. No extra services to run.
Per-node aggregation
Each node tracks its own metrics via telemetry, in memory, with negligible overhead and zero external dependencies.
Cluster-wide view
Metrics aggregates across nodes so you see the system beyond the web node you happen to be connected to.
Always on
No setup, no toggles, no migrations. Install Oban Web and metrics are available immediately.
One Dashboard, Multiple Runtimes
Oban for Elixir and for Python share the same schema and messaging, making it possible to run jobs in either runtime and observe them in the same place.
Shared schema
Elixir and Python nodes write to the same Oban tables for full cross-platform interop.
Shared PubSub
Share metrics between runtimes and pause, resume, and scale queues across runtimes.
One dashboard
The dashboard sees nodes, queues, crons and workflows across every runtime.
Get Oban Web
Add the dependency, mount the dashboard, and you're done.